Quick Start
A pangenome models the full set of genomic elements in a given species or clade. It can efficiently be encoded in the form of a variation graph, a type of sequence graph that embeds the linear sequences as paths in the graphs themselves.
To exchange pangenomes, the community frequently uses a strict subset of the Graphical Fragment Assembly GFA format
version 1 (GFAv1). To navigate such files efficiently,
odgi operates on a dynamic succinct variation graph representation, the odgi format.
Build graph from GFA
To construct an odgi file from a GFA file, execute:
wget https://raw.githubusercontent.com/pangenome/odgi/master/test/DRB1-3123.gfa
odgi build -g DRB1-3123.gfa -o DRB1-3123.og
The command creates a file called DRB1-3123.og, which contains the input graph in odgi format.
Note
If you know in advance that your graph is not optimized, and you want to run at least one of the following subcommands:
Then please execute odgi build with -O, --optimize in order
to ensure that you don't run into any problems later. odgi sort can optimize already built graphs.
In an optimized graph the minimum node identifier is one and the maximum node identifier is equal to the number of nodes in the graph.
Display graph stats
To have basic information on the graph, execute:
odgi stats -i DRB1-3123.og -S | column -t
#length nodes   edges   paths
21997   4955    6777    12
This graph file has the following properties:
the total number of nucleotides of all nodes is 21997;
it has 4955 nodes, 6777 edges, and 12 paths.
Display path names and extract paths
The path's names are:
odgi paths -i DRB1-3123.og -L
gi|568815592:32578768-32589835
gi|568815529:3998044-4011446
gi|568815551:3814534-3830133
gi|568815561:3988942-4004531
gi|568815567:3779003-3792415
gi|568815569:3979127-3993865
gi|345525392:5000-18402
gi|29124352:124254-137656
gi|28212469:126036-137103
gi|28212470:131613-146345
gi|528476637:32549024-32560088
gi|157702218:147985-163915
We can obtain their sequences in FASTA format:
odgi paths -i DRB1-3123.og -f > paths.fasta
head paths.fasta -n 2
>gi|568815592:32578768-32589835
ATTTAACTCCATCTTTGAGAAACATTTAATAATGTAATGTGTTTGTCATACAGGGTGAATACAGATGCACGGG...
Generate a 1D visualization
To visualize the graph, execute:
odgi viz -i DRB1-3123.og -o DRB1-3123.png -x 500
to obtain the following PNG image:
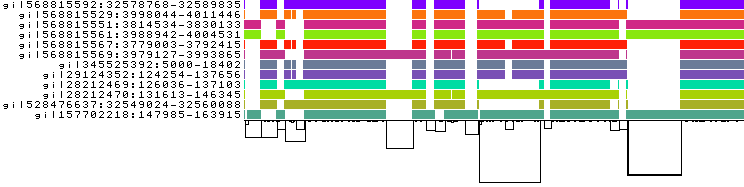
In this 1-Dimensional visualization:
The graph nodes are arranged from left to right, forming the
pangenome sequence.The colored bars represent the the paths versus the
pangenome sequencesin a binary matrix.The path names are visualized on the left.
The black lines under the paths are the links, which represent the graph topology.
See the odgi viz documentation for more information.