MultiQC Module
Since v1.11 MultiQC has an ODGI module. This module can only work with output from odgi stats! In the following, it is shown how to use ODGI in order to get a nice MultiQC report.
Install MultiQC
Ensure that you have python and pip installed. Then you can just run:
pip install multiqc --user
MultiQC with One Graph
Assuming that your current working directory is the root of the odgi project, please switch to the test folder via:
cd test
Let's go from GFA to odgi:
odgi build -g DRB1-3123.gfa -o DRB1-3123.gfa.og
To see the full statistics in YAML format of the graph, execute:
odgi stats -i DRB1-3123.gfa.og -m -sgdl
This prints the following YAML to stdout:
---
length: 21997
nodes: 4955
edges: 6777
paths: 12
num_weakly_connected_components: 1
weakly_connected_components:
  - component:
          id: 0
          nodes: 4955
          is_acyclic: 'yes'
num_nodes_self_loops:
  total: 0
  unique: 0
A: 6306
C: 4728
G: 4440
N: 944
T: 5579
mean_links_length:
  - length:
          path: all_paths
          in_node_space: 0.695637
          in_nucleotide_space: 2.86741
          num_links_considered: 35047
          num_gap_links_not_penalized: 0
sum_of_path_node_distances:
  - distance:
          path: all_paths
          in_node_space: 1.97732
          in_nucleotide_space: 1.88392
          nodes: 35059
          nucleotides: 163416
          num_penalties: 3095
          num_penalties_different_orientation: 0
Note
MultiQC's odgi module can only work with exactly this output! If you specify other options for odgi stats, MultiQC will complain!
Let's save the statistics this time:
odgi stats -i DRB1-3123.gfa.og -m -sgdl > DRB1-3123.gfa.og.stats.yaml
Note
For the odgi module to discover the odgi stats report(s), the file must match one of the following patterns:
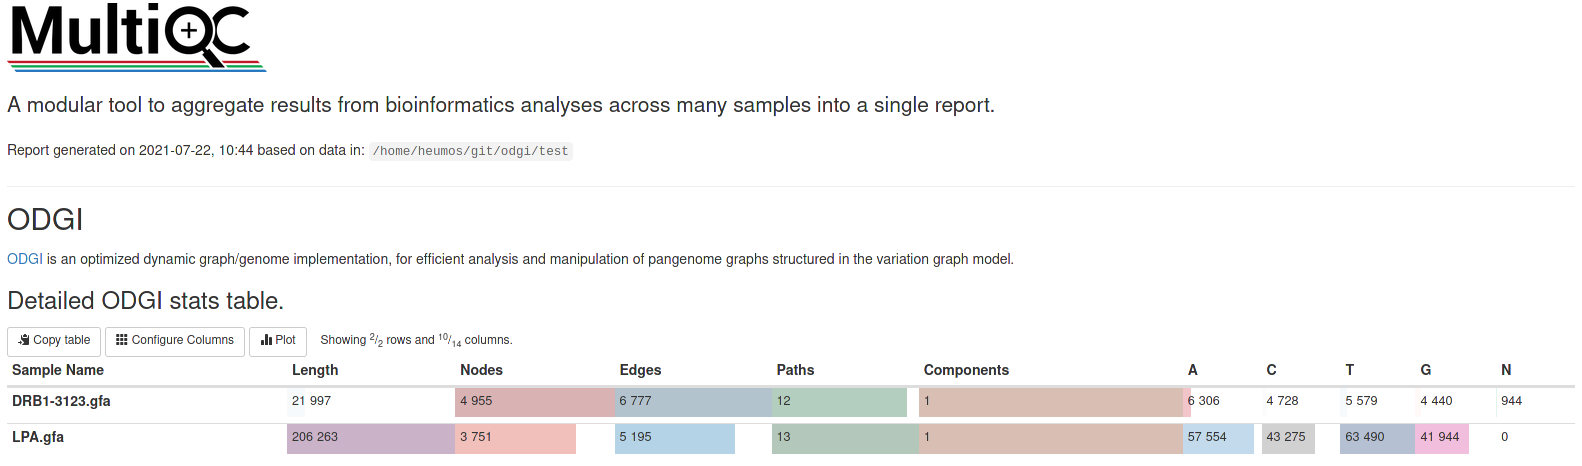
We are ready to generate our first report!
multiqc .
Open the multiqc_report.html in your browser of choice and you should see something similar to:
But what about graph visualizations? They are integrable into such a report, too :)
odgi viz -i DRB1-3123.gfa.og -o DRB1-3123.gfa.og.viz.png
odgi layout -i DRB1-3123.gfa.og -o DRB1-3123.gfa.og.lay
odgi draw -i DRB1-3123.gfa.og -c DRB1-3123.gfa.og.lay -p DRB1-3123.gfa.og.lay.draw.png -w 10 -C
Now we have to tell MultiQC that we created some custom content and want to integrate the PNGs into the report. Therefore, we create the following multiqc_config.yaml file:
# Report section config for nice titles and descriptions
custom_data:
  odgi_draw:
        section_name: ODGI 2D graph visualization
        description: The rendering shows a 2D layout of the graph.
  odgi_viz:
        section_name: ODGI 1D graph visualization
        description: The rendering shows a 1D layout of the graph.

# Custom search patterns to find the image outputs
sp:
  odgi_draw:
        fn: "*og.lay.draw.png"
  odgi_viz:
        fn: "*og.viz.png"
ignore_images: false

# Make the custom content stuff come after the ODGI module output
module_order:
  - odgi
  - custom_content

# Set the order that the custom content plots should come in
custom_content:
  order:
        - odgi_viz
        - odgi_draw
We can run:
multiqc -f .
This generates a new report. -f ensures that we overwrite the existing one.
MultiQC with Several Graphs
Assuming, we have several graphs, of which we want to compare the statistics from. Let's first build and visualize a second graph:
Note that the new PNGs now end with _mqc.png. That's because MultiQC's custom content feature as shown in the configuration file above can only handle single matches.
All additional matches are ignored and the PNGs are not added to the report. However, if we append _mqc.png to all our PNG names,
MultiQC can detect these, again. But be careful, you don't want tens of megabytes of PNGs in your report!
mv DRB1-3123.gfa.og.viz.png DRB1-3123.gfa.og.viz_mqc.png
mv DRB1-3123.gfa.og.lay.draw.png DRB1-3123.gfa.og.lay.draw_mqc.png
multiqc -f .
In this final report, you can compare the statistics of the two graphs and take a look at their 1D and 2D visualizations.
Note
If .fa appears in your file name, it is recommended to remove this from the name. Else MultiQC will think it is a sample name and if
you have graphs with the same sample name, but a different suffix, MultiQC can't distinguish between them.