Navigating and annotating graphs
Author: Simon Heumos
Synopsis
Coordinates in variation graphs are provided by embedded path sequences. The node ids are not meant to be stable. Translating path positions between graphs reveals the nodes of each graph that are traversed by e.g. the same reference sequence present in all graphs. This is particularly helpful when two studies make different graphs, but incorporated the same annotated reference sequence. The graphs may differ, but were well build individually. Picking the annotated reference sequence as the backbone to compare gene regions, odgi position can help to answer questions like:
Where is this gene in the other graph?
What other paths are crossing it?
Is there variation going on?
Once key regions are identified, they can be extracted with odgi extract and visualized in 1D with odgi viz or in 2D with odgi layout and odgi draw.
Note
In the following, all node identifiers are one-based. This means we start to enumerate them at 1. All nucleotide positions and offsets are zero-based. This means the first nucleotide position or first offset is 0.
Steps
Let's build a small test graph which is used throughout this tutorial:
odgi build -g test/k.gfa -o k.og
Using vg, we can obtain the graph in dot format:
vg view -F -p -d test/k.gfa > k.gfa.dot
And use Graphviz to obtain a nucleotide-level visualization:
dot -Tpng k.gfa.dot -o k.gfa.dot.png
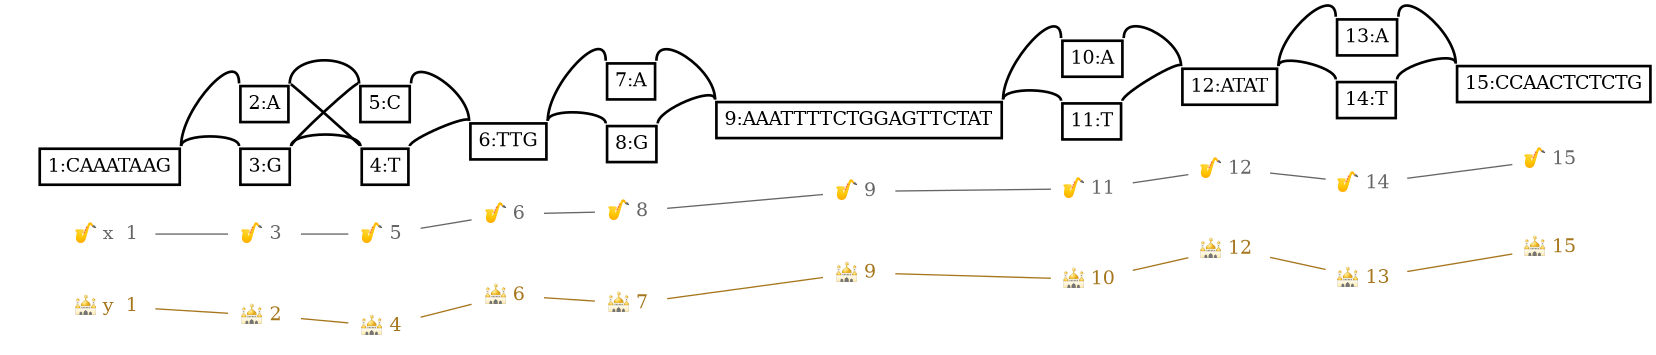
Note
Ensure that you have a font package for emojis installed. Noto Color Emoji is recommended. Or see a list of Ubuntu packages.
Path to graph position mapping
Take a path position in a graph and display its corresponding graph position.
Let's find out the graph position of the path y at nucleotide position 10.
odgi position -i k.og -p y,10,+ -v
Where:
-pspecifies the path to find the graph position from as a comma-separated triple:The name of the path.
The nucleotide position of the path.
The orientation at the give nucleotide position of the path.
-vensures that we actually receive graph positions instead of path positions.
We observe on stdout:
#source.path.pos  target.graph.pos
y,10,+            6,0,+
The graph position is encoded as a comma-separated triple:
The node identifier.
The nucleotide position of the graph if all nodes where traversed in ascending node identifier order.
The orientation of the node.
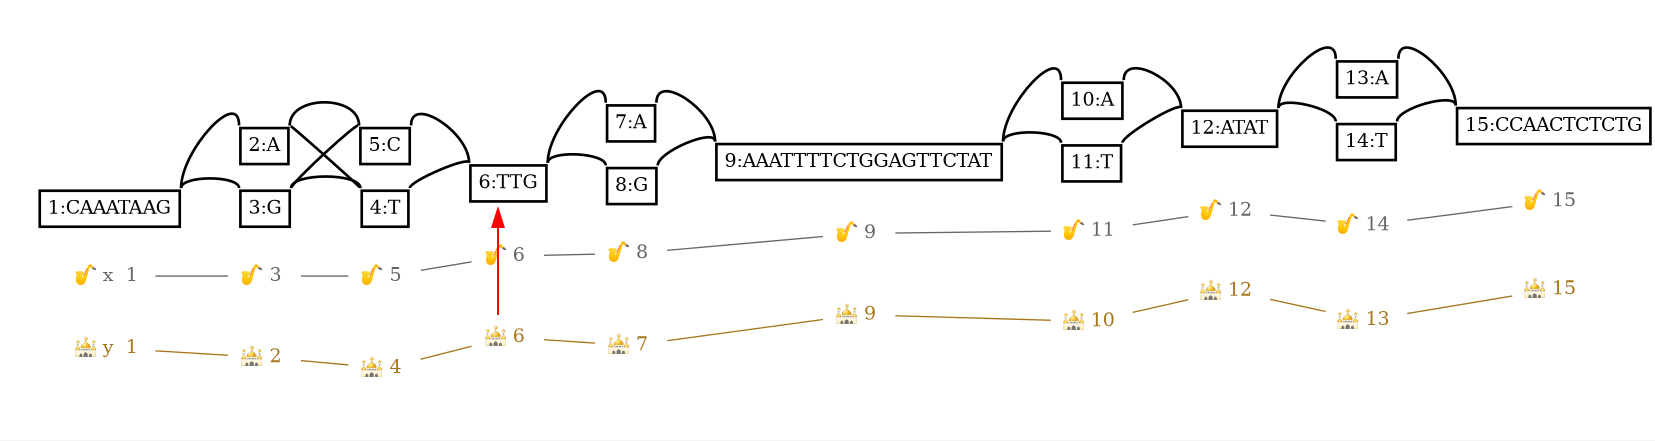
The red arrow highlights the found graph position.
Path to path position mapping
Take a path position in a graph and display the nearest position and distance to that position of a given reference
path. Let's find out the reference position of the path x by given path y at nucleotide position 10.
odgi position -i k.og -p y,10,+ -r x
Where:
-pspecifies the path to find the graph position from as a comma-separated triple:The name of the path.
The nucleotide position of the path.
The orientation at the give nucleotide position of the path.
-rspecifies the reference path.
We observe on stdout:
#source.path.pos  target.path.pos  dist.to.ref  strand.vs.ref
y,10,+            x,10,+           0            +
The red arrow highlights the found path position.
Graph to path position mapping
Take a node identifier and display the path and position starting in this node.
Let's find out a path position of the given node identifier 6.
odgi position -i k.og -g 6
Where:
-gspecifies the node identifier to find the path position from.
We observe on stdout:
#target.graph.pos  target.path.pos  dist.to.path  strand.vs.ref
6,0,+              x,10,+           0             +
The red arrow highlights the found path position.
Graph offset to path position mapping
Take a node identifier and an offset in that node. Display the path and position starting in this node.
Let's find out a path position of the given node identifier 6 and offset 2.
odgi position -i k.og -g 6,2
Where:
-gspecifies the node identifier and offset to find the path position from.
We observe on stdout:
#target.graph.pos  target.path.pos  dist.to.path  strand.vs.ref
6,2,+              x,12,+           0             +
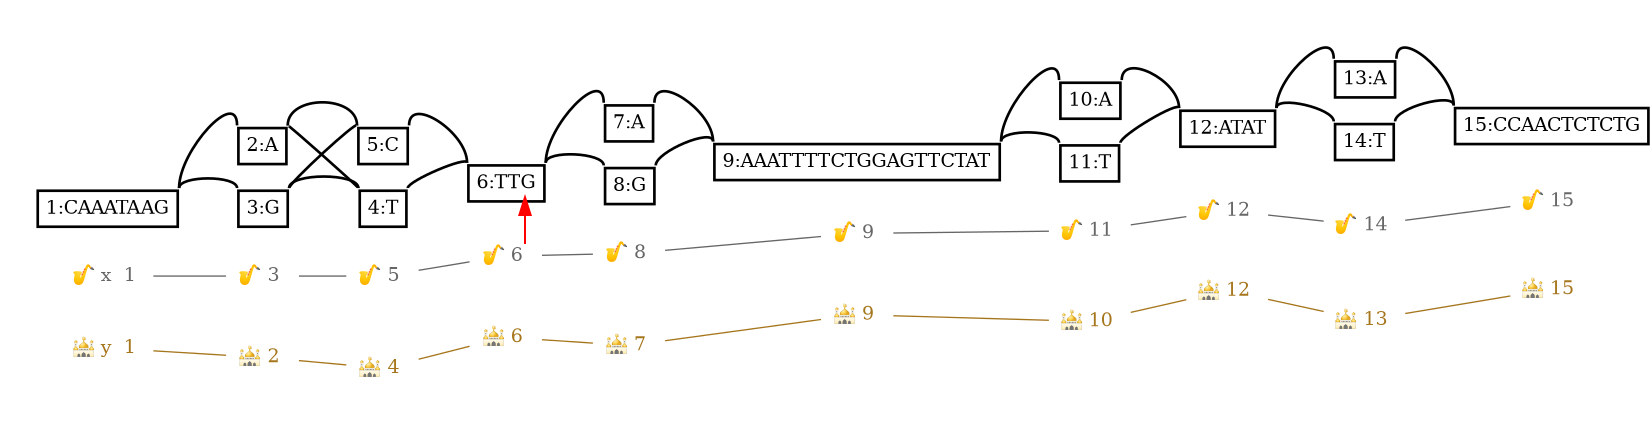
The red arrow highlights the found path position.
Graph to reference position mapping
Take a node identifier and reference path. Display the reference path including position starting in this node.
Let's find out a path position of the given node identifier 4 and reference path x.
odgi position -i k.og -g 4 -r x
Where:
-gspecifies the node identifier to find the path position from.-rspecifies the reference path.
We observe on stdout:
#target.graph.pos  target.path.pos  dist.to.ref  strand.vs.ref
4,0,+              x,9,+            1            +
Traversing along the node identifier order, the next reference position from the given node is 1 nucleotide away. The walked distance to the reference is reported when it's > 0.
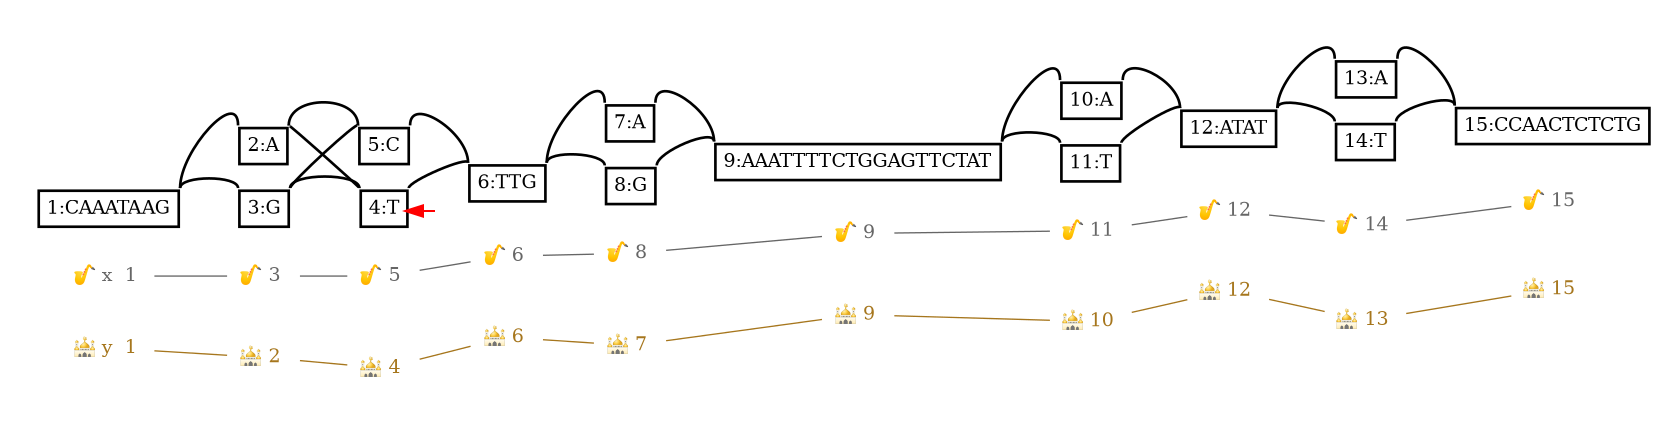
The red arrow highlights the node we start our walk from to go to the next reference position.
The Lift: Graph to graph position mapping
Take a path position in a source graph, and use the common paths between the source and target to project it into the
target graph. Let's find out the graph position in target graph q.chop.og by given path position y,10,+ in source
graph k.og.
odgi build -g test/q.chop.gfa -o q.chop.og
odgi position -i q.chop.og -x k.og -p y,10,+ -v
Where:
-ispecifies the target graph.-xthe source graph.-vensures that we actually receive graph positions instead of path positions.
We observe on stdout:
#source.path.pos  target.graph.pos
y,10,+            9,0,+
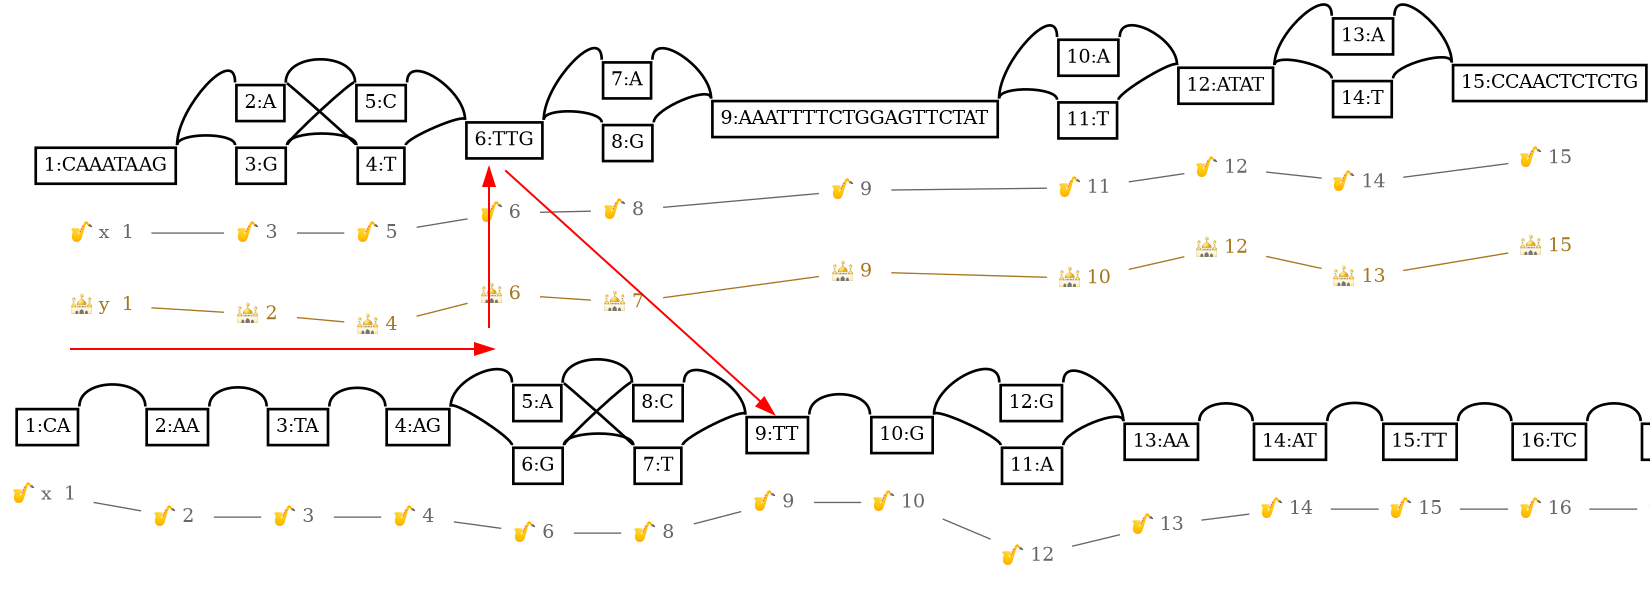
Annotating the nodes with a GFF/GTF
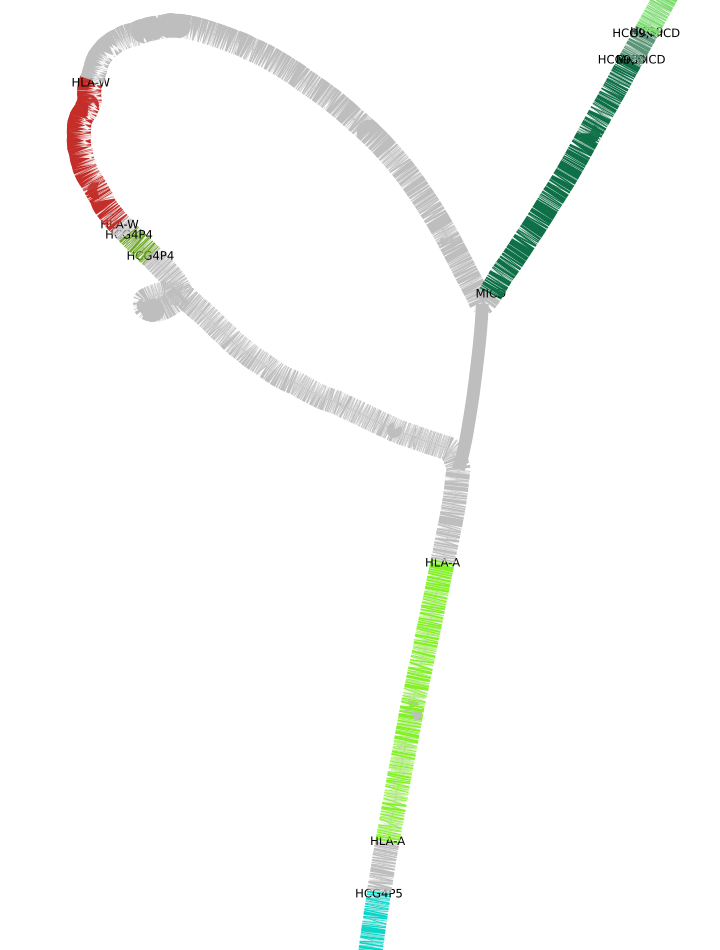
Take a (sub)graph, and a complementary GFF/GTF we can annotate each node in the graph producing a CSV ready for Bandage. In the following, we will download a 90 haplotypes chromosome 6 human pangenome graph, extract the HLA region and produce a CSV to take a look at the annotated nodes in Bandage.
wget https://s3-us-west-2.amazonaws.com/human-pangenomics/pangenomes/scratch/2021_10_11_pggb_wgg.85/chroms/chr6.pan.fa.a2fb268.4030258.b5c839f.smooth.gfa.gz
gunzip chr6.pan.fa.a2fb268.4030258.b5c839f.smooth.gfa.gz
odgi build -g chr6.pan.fa.a2fb268.4030258.b5c839f.smooth.gfa -o chr6.pan.fa.a2fb268.4030258.b5c839f.smooth.gfa.og -P -t 28
odgi extract -i chr6.pan.fa.a2fb268.4030258.b5c839f.smooth.gfa.og -r grch38#chr6:29000000-34000000 -o - -t 28 -P -c 0 -E | odgi sort -i - -o chr6.pan.fa.a2fb268.4030258.b5c839f.smooth.gfa.og.29-34.og -O
We downloaded the graph, unpacked it, translated it into the odgi format and extracted the HLA region.
wget https://hgdownload.soe.ucsc.edu/goldenPath/hg38/bigZips/genes/hg38.ncbiRefSeq.gtf.gz
gunzip hg38.ncbiRefSeq.gtf.gz
grep -P "chr6\t" hg38.ncbiRefSeq.gtf | less -S | grep -P "transcript\t" | cut -f 1 -d';'| less -S | sed 's/gene_id //g' | sed 's/"//g' | uniq | sed 's/chr6/grch38#chr6/g' > hg38.grch38#chr6.gtf
odgi position -i chr6.pan.fa.a2fb268.4030258.b5c839f.smooth.gfa.og.29-34.og -E hg38.grch38#chr6.gtf -t 16 > chr6.pan.fa.a2fb268.4030258.b5c839f.smooth.gfa.og.29-34.og.anno.csv
odgi view -i chr6.pan.fa.a2fb268.4030258.b5c839f.smooth.gfa.og.29-34.og -g >chr6.pan.fa.a2fb268.4030258.b5c839f.smooth.gfa.og.29-34.og.gfa
We downloaded the annotation, set the correct reference identifier, only filtered for 'transcript, and only kept the actual gene identifier. odgi position then gave us the CSV ready for Bandage and odgi view translated our ODGI graph into the GFA format. Below you can see an example screenshot.