Detect complex regions
Author: Andrea Guarracino
Synopsis
Human chromosomes have large regions of highly identical repeats. They can be found in clusters, centromeres,
regions of segmental duplication, or in the acrocentric short arms of chromosomes.
Logsdon et al., 2021 showed that chromosome 8 carries a modestly sized
centromere of approximately 1.5–2.2 Mb, in which AT-rich, 171-base-pair (bp) α-satellite
repeats are organized into a well-defined higher-order repeat (HOR) array. odgi offers tools to detect and explore
such regions.
Steps
Get the Human chr8 dataset
Download the pangenome graph of the Human chromosome 8
in GFA format, decompress it, and convert it to a graph in odgi format:
wget -c https://s3-us-west-2.amazonaws.com/human-pangenomics/pangenomes/scratch/2021_05_06_pggb/gfas/chr8.pan.gfa.gz
gunzip chr8.pan.gfa.gz

odgi build -g chr8.pan.gfa -o chr8.pan.og --threads 2 -P
The last command creates a file called chr8.pan.og, which contains the input graph in odgi format. This graph contains
the contigs of 88 haploid, phased human genome assemblies from 44 individuals, plus the chm13 and GRCh38 reference genomes.
Obtain the depth over the pangenome
To identify repetitive sequences, we analyze the depth in the graph. Here we define node depth as the number of times in which a node is crossed by all paths in the graph.
To obtain the depth over the pangenome graph, execute:
odgi depth -i chr8.pan.og -r chm13#chr8 | \
    bedtools makewindows -b /dev/stdin -w 5000 > chm13.chr8.w5kbps.bed

odgi depth -i chr8.pan.og -b chm13.chr8.w5kbps.bed --threads 2 | \
    bedtools sort > chr8.pan.depth.w5kbps.bed
The chm13.chr8.w5kbps.bed file contains 5000 bps interval windows across the chm13 reference chromosome 8. The depth
is computed for each of these windows, writing the result in the chr8.pan.depth.w5kbps.bed file, in BED format.
-r specifies the path name from which to compute the depth from. -b specifies the BED ranges of which the
depths should be calculated of.
Note
It will take a while to obtain the depth over all the windows. You can find the gzipped result in the test folder
in the root of the odgi project, in the chr8.pan.depth.w5kbps.bed.gz file. Gunzip the file before using it.
Take a look at the first rows of the chr8.pan.depth.w5kbps.bed file:
head chr8.pan.depth.w5kbps.bed -n 5 | column -t
chm13#chr8  0      5000   60.1014
chm13#chr8  5000   10000  89.5402
chm13#chr8  10000  15000  91.1302
chm13#chr8  15000  20000  90.0506
chm13#chr8  20000  25000  94.0238
The 4-th column indicates the mean depth of each window. For each node within a window, the product between the node
depth and its length (in bp) is calculated. The overall total sum is divided by the length of the window (in bp). This
results in the mean depth.
Plot the depth
Plotting the mean depth distribution:
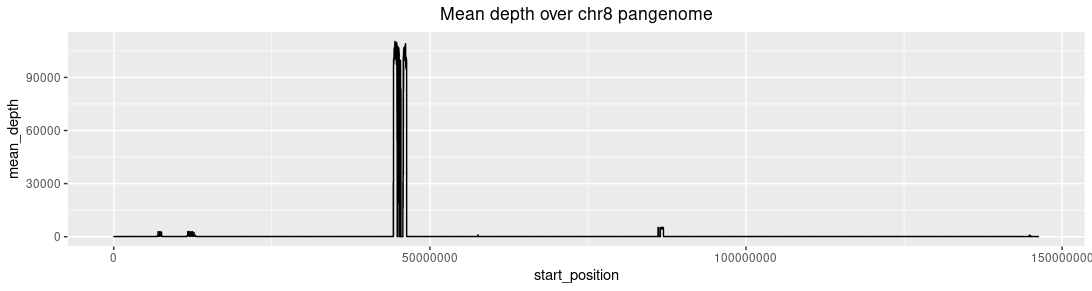
Mean depth distribution of chromosome 8: Three high depth regions are present. Left: The β-defensin gene
cluster. Mid: The centromere. Right: The neo-centromere.
The centromere's Higher-Order Repeat (HOR) organization
The chromosome 8 centromeric HOR array is primarily composed of four distinct HOR types represented by 4, 7, 8 or
11 α-satellite monomer cassettes. Thankfully, Logsdon et al., Nature 2021 provide HOR
annotations (you can find them in the test folder in the root of the odgi project, in the chr8_HORarray_organization.colors.bed
file), so we can take a closer look at the centromere:
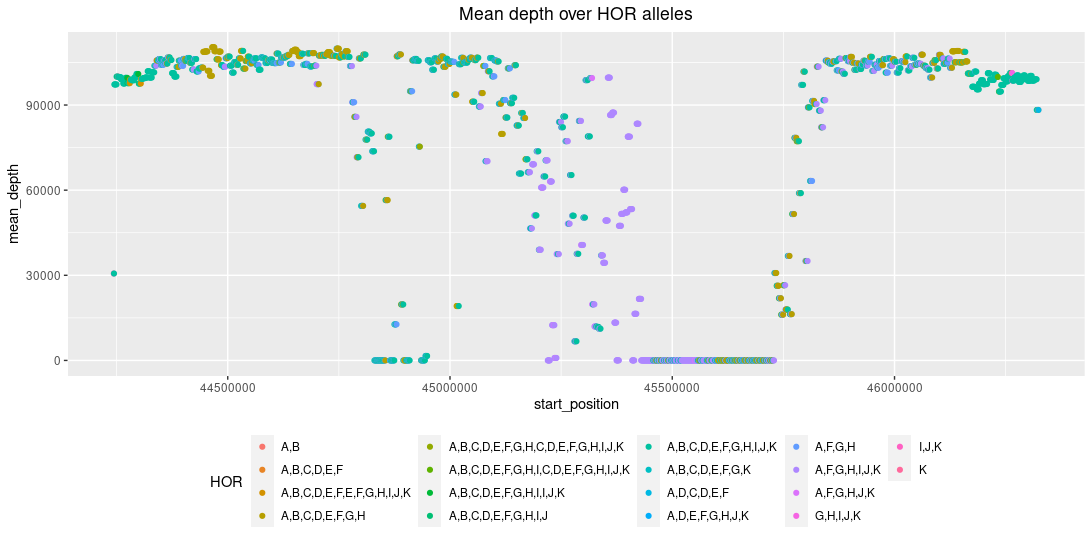
Mean depth of the chromosome 8 centromeric HOR array. Every letter indicates an alpha-satellite monomer in the HOR (so, A,B,C,D,E,F,G,H,I,J,K
would indicate an HOR with 11 alpha-satellite monomers). The mean depth drop falls into the hypomethylated and CENP-A-enriched regions, that have the highest consistent
entropy in the entire array. This is in concordance with the Logsdon et al., Nature 2021
publication, see the figure below. The drop in the depth may indicate hypervariability between genomes in the transition from methylated
to unmethylated DNA, or that the region is not alignable.
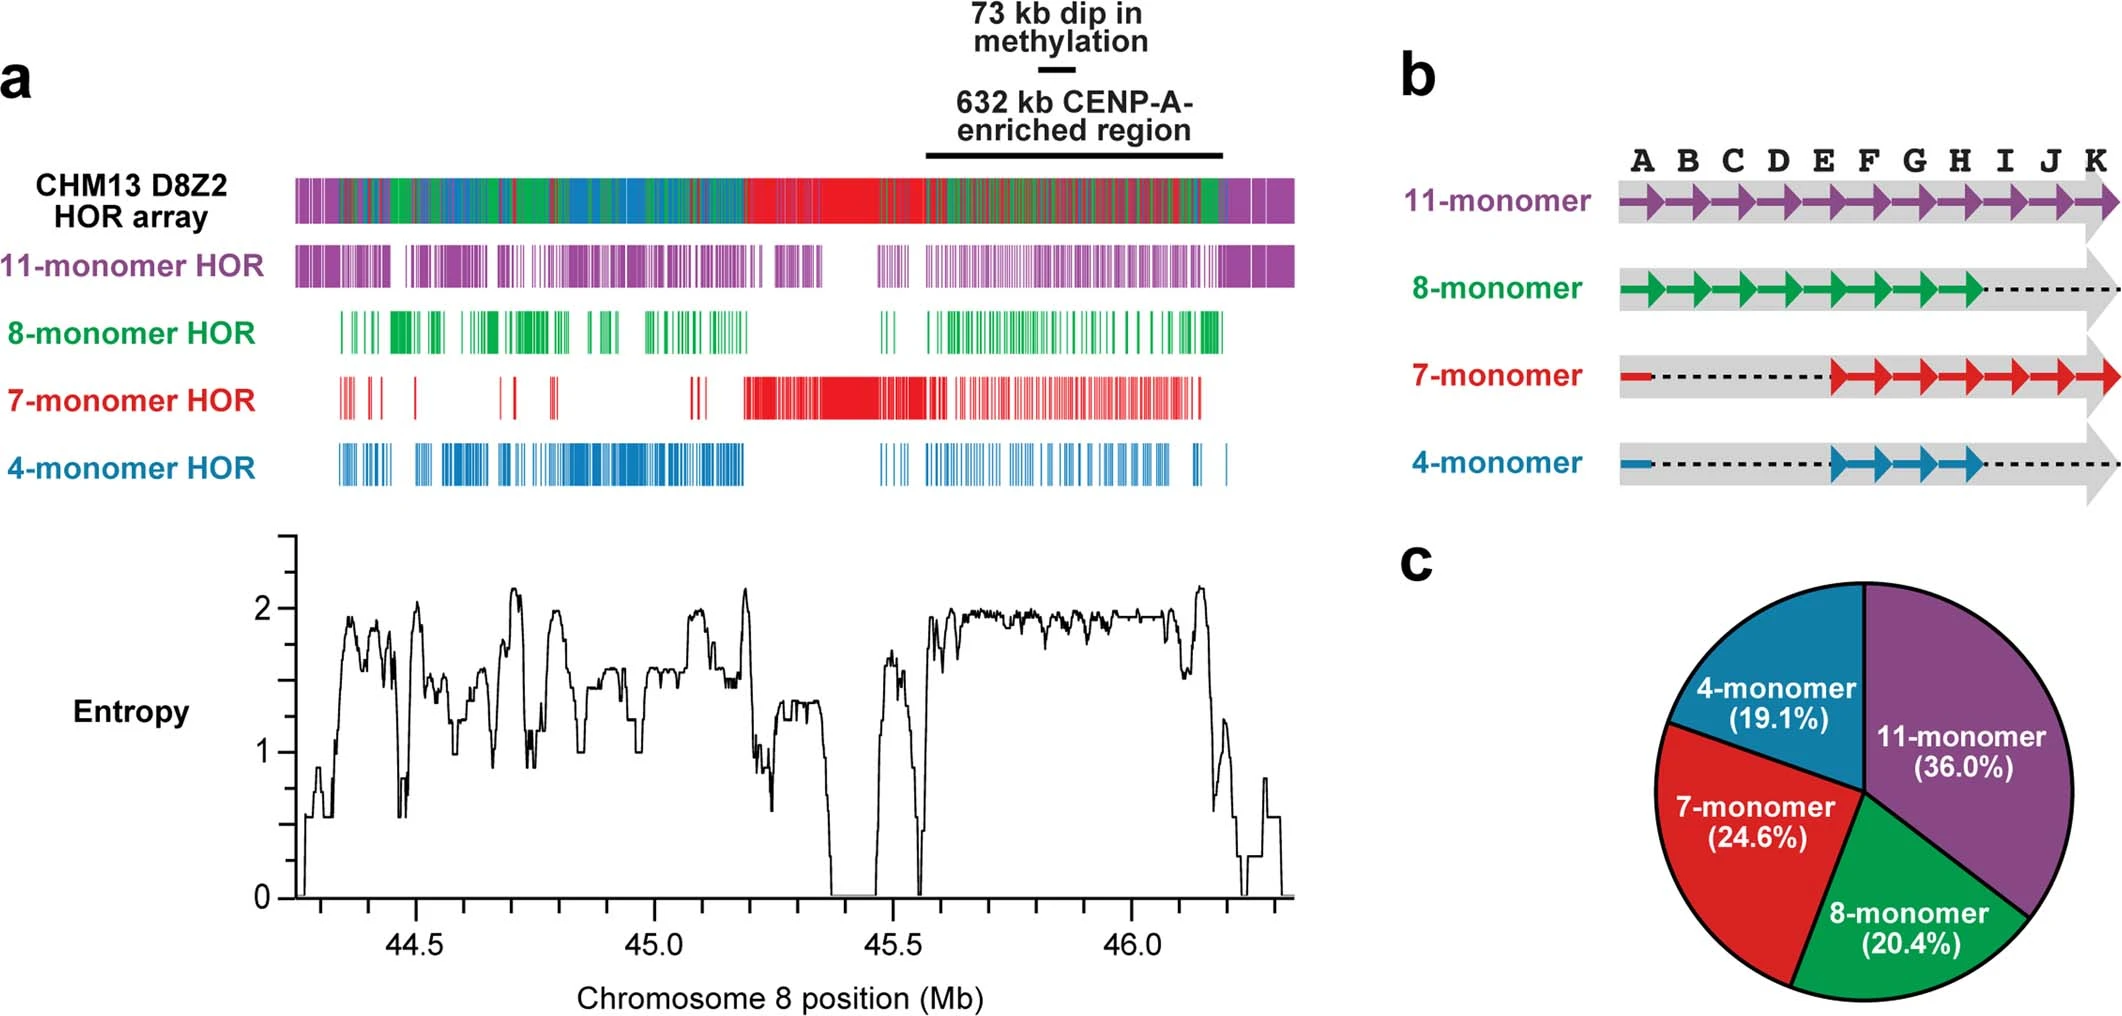
Overview of the chm13 chromosome 8 D8Z2 α-satellite HOR array. a (top): Monomer arrangements of the HOR. a (bottom): The entropy plot of chromosome 8 reveals that the hypomethylated and CENP-A-enriched regions, that have the highest consistent entropy in the entire array. b: Structure of the α-satellite monomers listed by HOR. c: Frequency plot of the α-satellite monomers in the HOR. Figure taken from Logsdon et al., Nature 2021.