Sort and Layout
Author: Simon Heumos
Synopsis
Pangenome graphs built from raw sets of alignments may have complex structures which can introduce difficulty in downstream analyses, visualization, mapping, and interpretation. Graph sorting aims to find the best node order for a 1D and 2D layout to simplify these complex regions. This tutorial shows how to sort and visualize a graph in 1D. It explains how to generate a 2D layout of a graph, and how to take a look at the calculated layout using static and interactive tools.
For more details about the applied algorithm, please take a look at https://www.biorxiv.org/content/10.1101/2023.09.22.558964v2.
Note
Be aware that odgi sort offers much more sorting algorithms than this tutorial could cover here in detail.
1D sorting
Build the unsorted DRB1-3123 graph
To construct an odgi graph from the DRB1-3123 dataset in GFA format, execute:
wget https://raw.githubusercontent.com/pangenome/odgi/master/test/DRB1-3123_unsorted.gfa
odgi build -g DRB1-3123_unsorted.gfa -o DRB1-3123_unsorted.og
The command creates a file called DRB1-3123_unsorted.og, which contains the input graph in odgi format. This graph contains
12 ALT sequences of the HLA-DRB1 gene from the GRCh38 reference genome.
The graph was initially created with the seqwish variation graph inducer which produces unsorted, raw graphs from
all versus all alignments of the input sequences.
Visualize the unsorted DRB1-3123 graph
odgi viz -i DRB1-3123_unsorted.og -o DRB1-3123_unsorted.png
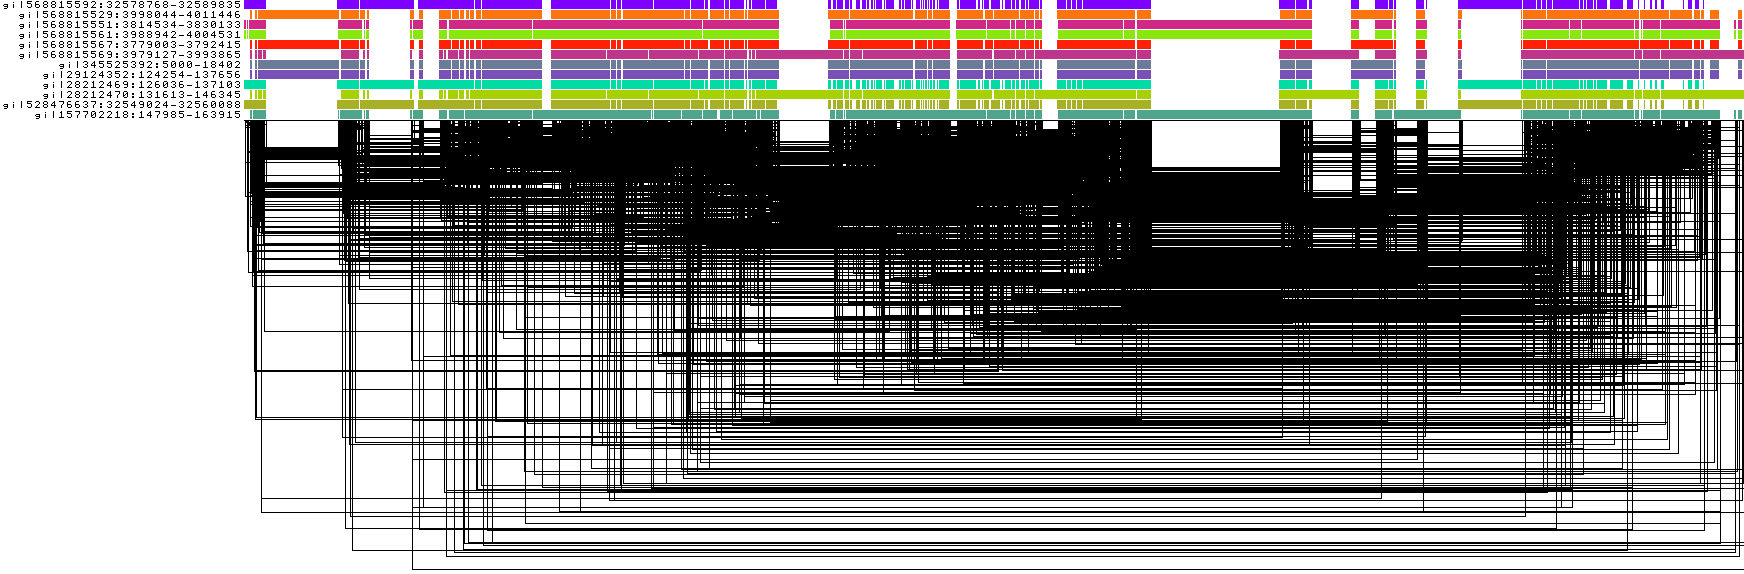
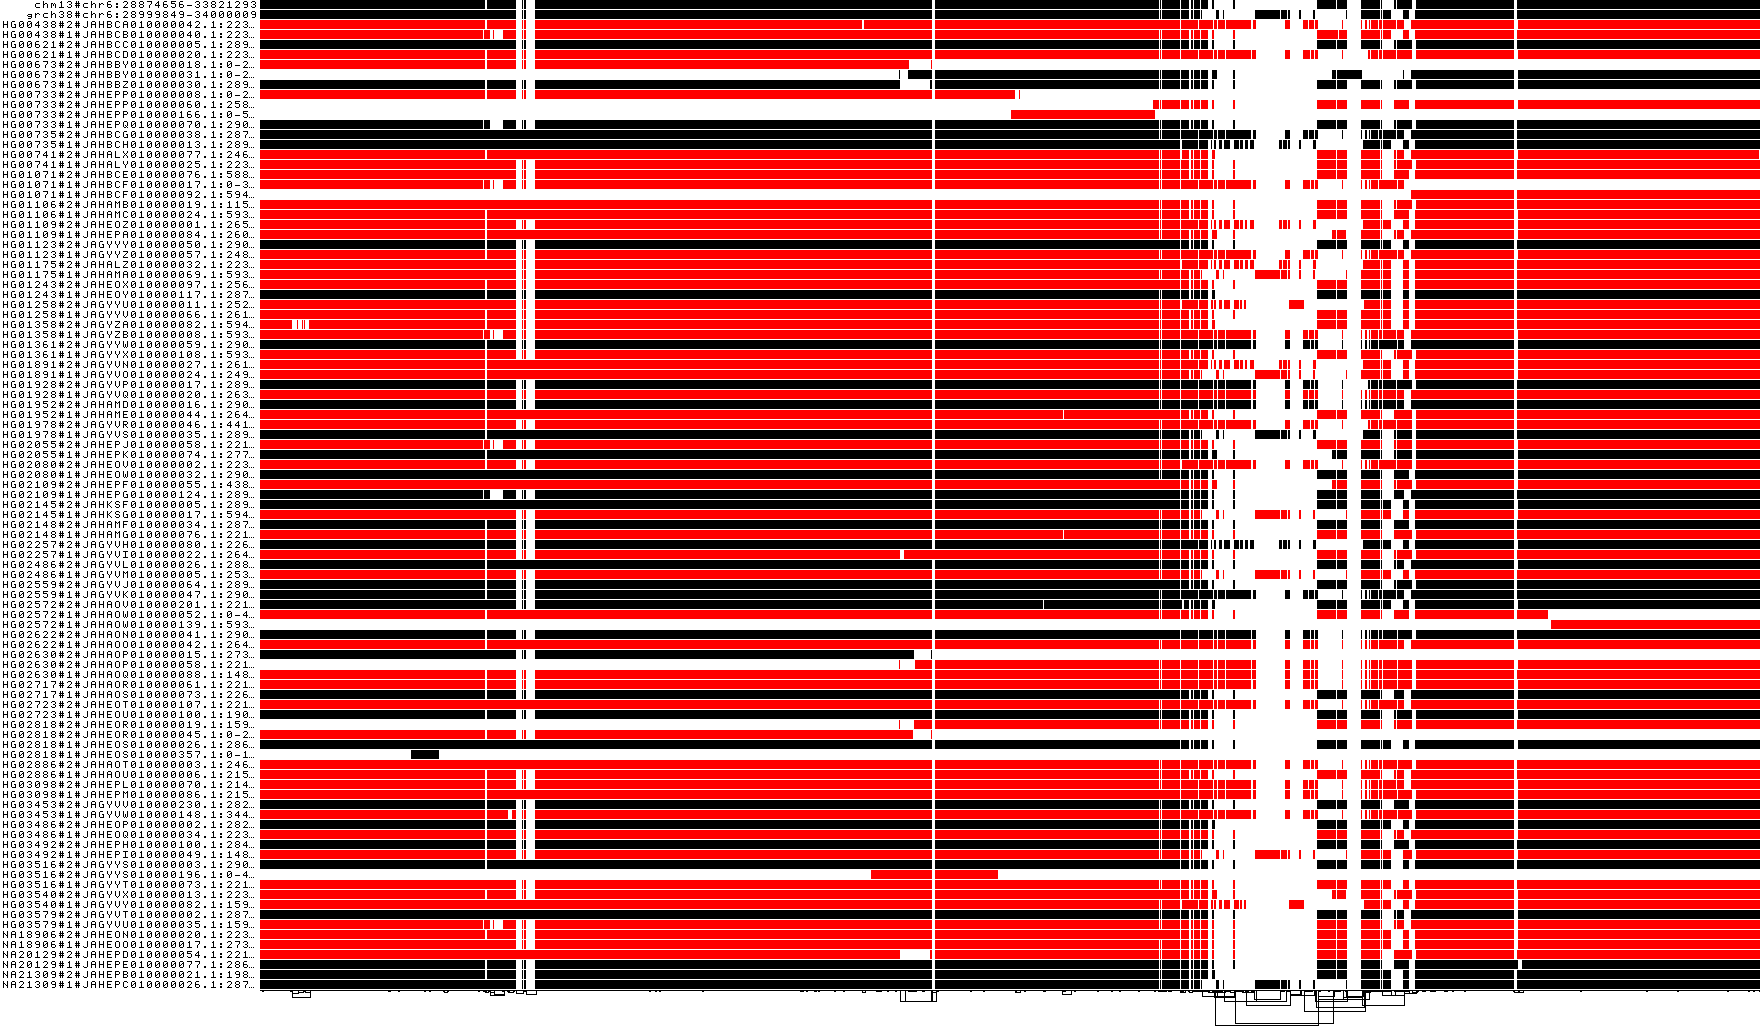
To obtain the following PNG image:
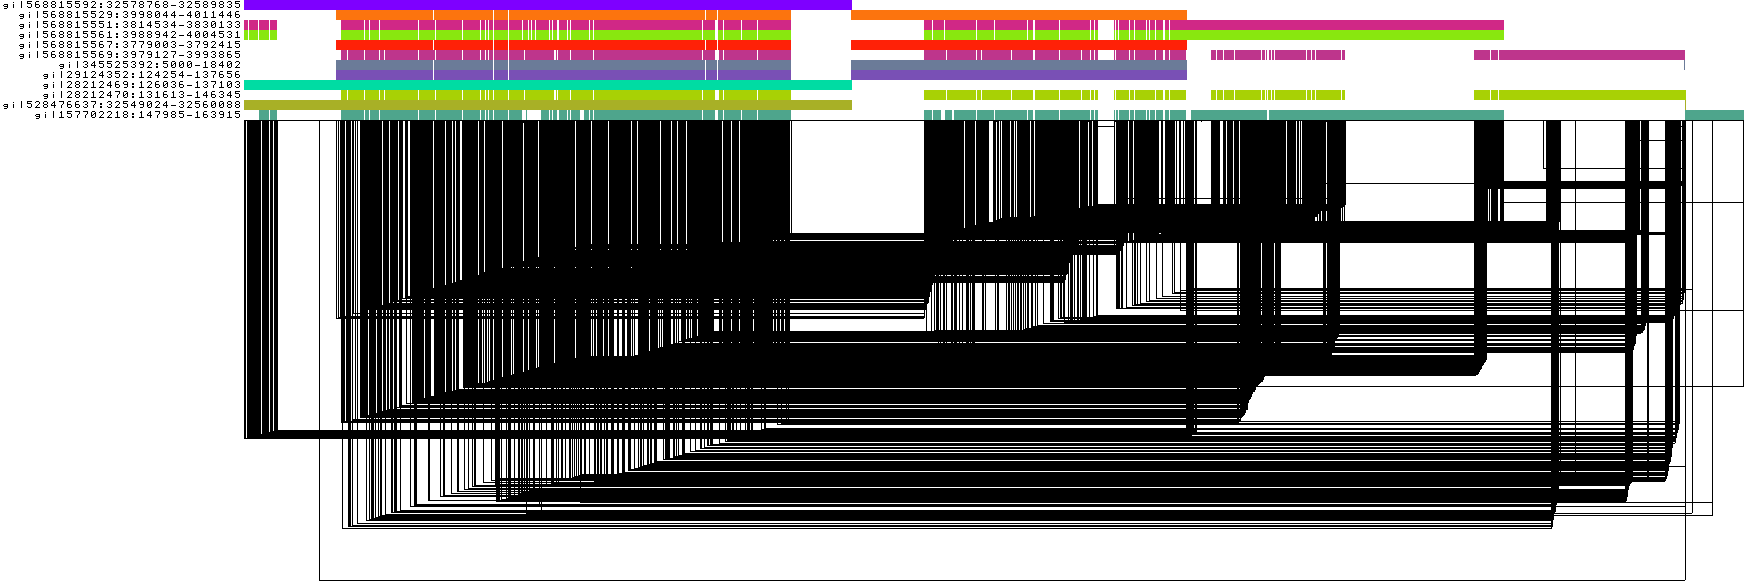
In this 1-Dimensional visualization:
The graph nodes are arranged from left to right, forming the
pangenome sequence.The colored bars represent the binned, linearized renderings of the embedded paths versus this
pangenome sequencein a binary matrix.The path names are visualized on the left.
The black lines under the paths are the links, which represent the graph topology.
The graph is very complex and, in this form, the underlying structure is unclear, making it difficult to reason from it. odgi offers algorithms to find the best 1D node order effectively linearizing the graph.
1D layout metrics of the unsorted DRB1-3123 graph
odgi stats provides metrics to evaluate the goodness of the sort of a variation graph. Let's take a look:
odgi stats -i DRB1-3123_unsorted.og -s -d -l -g
Where:
-scalculates the sum of path node distances.-lcalculates the mean links length.-dadditionally penalizes links which connect nodes with different orientation.-gensures that gap links, links directly travelling from left to right encoding simple structural variants, are not penalized.
For further details on these metrics please take a look at the odgi stats command.
We observe on stdout:
#mean_links_length
path        in_node_space   in_nucleotide_space     num_links_considered    num_gap_links_not_penalized
all_paths   514.698 4016.92 21870   11116
#sum_of_path_node_distances
path        in_node_space   in_nucleotide_space     nodes   nucleotides     num_penalties   num_penalties_different_orientation
all_paths   1029.84 1076.32 21882   163416  6085    1
Sort the unsorted DRB1-3123 graph in 1D
Let's sort the graph:
odgi sort -i DRB1-3123_unsorted.og --threads 2 -P -Y -o DRB1-3123_sorted.og
-Y selects the PG-SGD algorithm for sorting. This algorithm moves a single pair of nodes at a time, optimizing
the disparity between the layout distance of a node pair and the actual nucleotide distance of a path traversing these
nodes.
Note
The PG-SGD is not deterministic, because of its Hogwild! approach. For more details about the applied algorithm, please take a look at https://www.biorxiv.org/content/10.1101/2023.09.22.558964v2.
Note
The 1D PG-SGD implementation comes with a huge amount of tunable parameters. Based on our experience applying it to hundreds of graphs, the current defaults usually work well for most graphs. However, if you feel the sorting did not work well enough, there are 2 key parameters one can tune:
-G, --path-sgd-min-term-updates-paths=N: The minimum number of terms to be updated before a new path-guided linear 1D SGD iteration with adjusted learning rate eta starts, expressed as a multiple of total path steps (default: 1.0).-x, --path-sgd-iter-max=N: The maximum number of iterations for path-guided linear 1D SGD model (default: 100).
Increasing both can lead to a better sorted graph. For example, one can start optimizing with setting -x, --path-sgd-iter-max=200. For more parameter details please take a look at odgi sort.
Visualize the 1D sorted DRB1-3123 graph
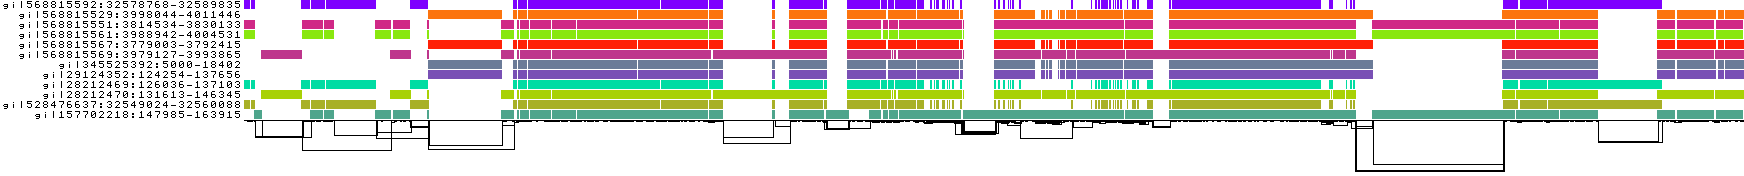
odgi viz -i DRB1-3123_sorted.og -o DRB1-3123_sorted.png
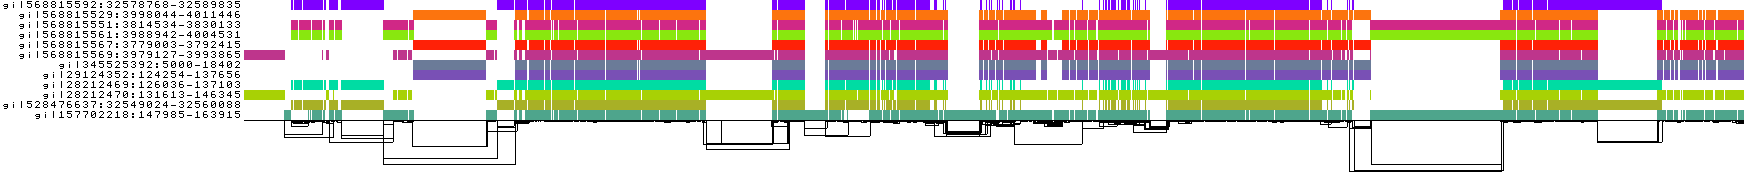
The graph lost it's complexity and is now linear.
Bonus: the following animation represents what happens during the PG-SGD sorting.
1D layout metrics of the sorted DRB1-3123 graph
odgi stats -i DRB1-3123_sorted.og -s -d -l -g
This prints to stdout:
#mean_links_length
path        in_node_space   in_nucleotide_space     num_links_considered    num_gap_links_not_penalized
all_paths   2.15542 15.0529 21870   9481
#sum_of_path_node_distances
path        in_node_space   in_nucleotide_space     nodes   nucleotides     num_penalties   num_penalties_different_orientation
all_paths   4.66114 4.72171 21882   163416  5948    1
Compared to before, these metrics show that the goodness of the sorting of the graph improved significantly.
Playing around with the 1D PG-SGD parameters
What happens if the maximum number of iterations is very low?
odgi sort -i DRB1-3123_unsorted.og --threads 2 -P -Y -x 2 -o DRB1-3123_sorted.x2.og
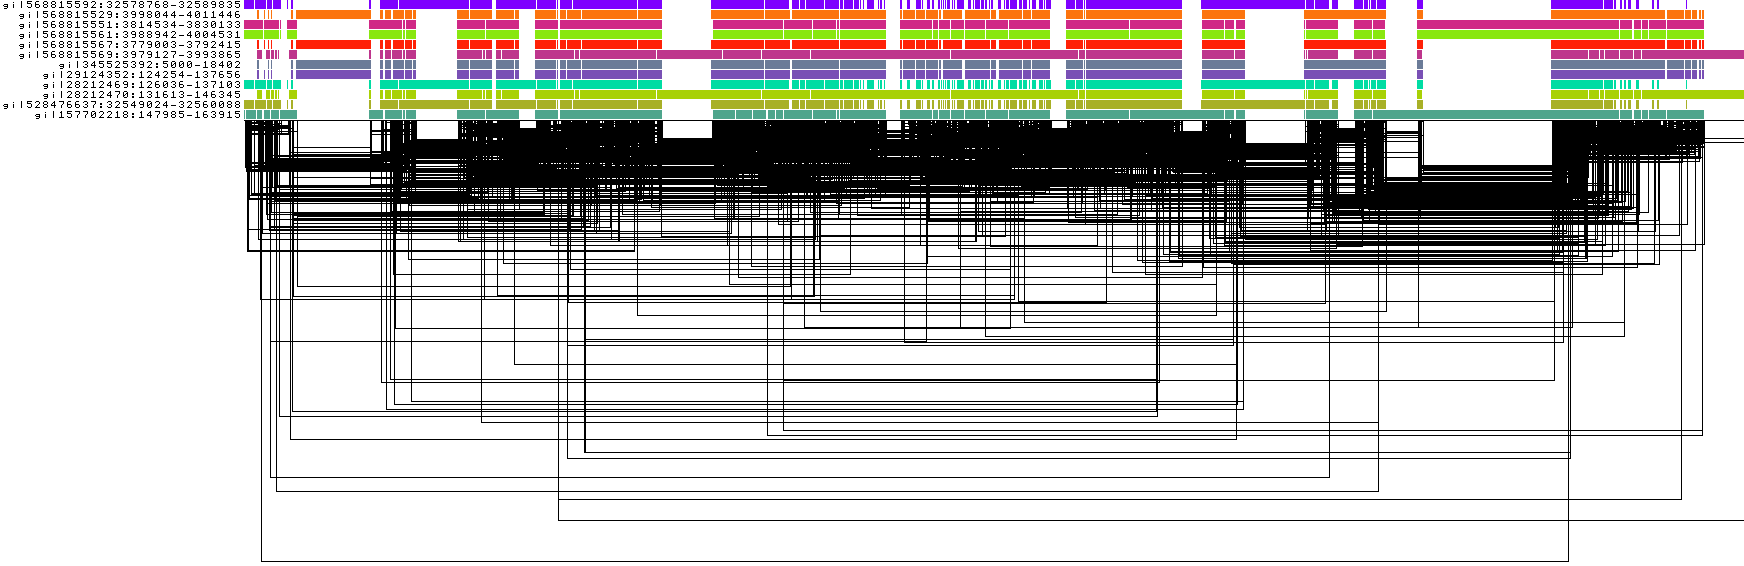
odgi viz -i DRB1-3123_sorted.x2.og -o DRB1-3123_sorted.x2.png
The graph appears very complex and not quite human readable. That's because in total there were two times the number of total path steps node position updates instead of one hundred times the number of total path steps, which is the current default. For very complex graphs, one may have to increase this number even further.
What happens if the minimum number of term updates is very high?
odgi sort -i DRB1-3123_unsorted.og --threads 2 -P -Y -U 1000 -o DRB1-3123_sorted.U1000.og
odgi viz -i DRB1-3123_sorted.U1000.og -o DRB1-3123_sorted.U1000.png
The graph lost it's complexity and is now linear. Compared to the 1D visualization using the default parameters, it is hard to spot any differences. So let's take a look at the metrics:
odgi stats -i DRB1-3123_sorted.U1000.og -s -d -l -g
This prints to stdout:
#mean_links_length
path    in_node_space   in_nucleotide_space     num_links_considered    num_gap_links_not_penalized
all_paths       1.00361 8.30677 21870   15195
#sum_of_path_node_distances
path    in_node_space   in_nucleotide_space     nodes   nucleotides     num_penalties   num_penalties_different_orientation
all_paths       3.23238 3.73489 21882   163416  3750    1
We actually were able to improve the metrics compared to using default parameters. However, the runtime increased from under 1 second to ~30 seconds. So one needs to be careful with such a parameter. Compared to the gains in linearity, such an additional time usage would be a huge waste with very large graphs.
What happens if the threshold of the maximum distance of two nodes is very high?
odgi sort -i DRB1-3123_unsorted.og --threads 2 -P -Y -j 10000 -o DRB1-3123_sorted.j10000.og
odgi viz -i DRB1-3123_sorted.j10000.og -o DRB1-3123_sorted.j10000.png
The graph appears very complex and not quite human readable. That's because the iterations are terminated as soon as the expected distance of two nodes, the nucleotide distance given by two randomly chosen path steps, is as close as 10000. Naturally, this happens very soon.
1D reference-guided grooming and reference-guided sorting
In the following, we will groom and sort a human MHC pangenome graph with respect to given references.
Extract the MHC graph from Chr6
prefix_chr6_smooth=chr6.pan.fa.a2fb268.4030258.6a1ecc2.smooth
# download and build the graph
wget https://s3-us-west-2.amazonaws.com/human-pangenomics/pangenomes/scratch/2021_11_16_pggb_wgg.88/chroms/${prefix_chr6_smooth}.gfa.gz
gunzip ${prefix_chr6_smooth}.gfa.gz
odgi build -g ${prefix_chr6_smooth}.gfa -o ${prefix_chr6_smooth}.og -t 16 -P
# extraction and optimization of the MHC locus
odgi extract -i ${prefix_chr6_smooth}.og -r grch38#chr6:29000000-34000000 -o - -c 0 --full-range -t 16 -P | odgi sort -i - -o ${prefix_chr6_smooth}.mhc.og --optimize
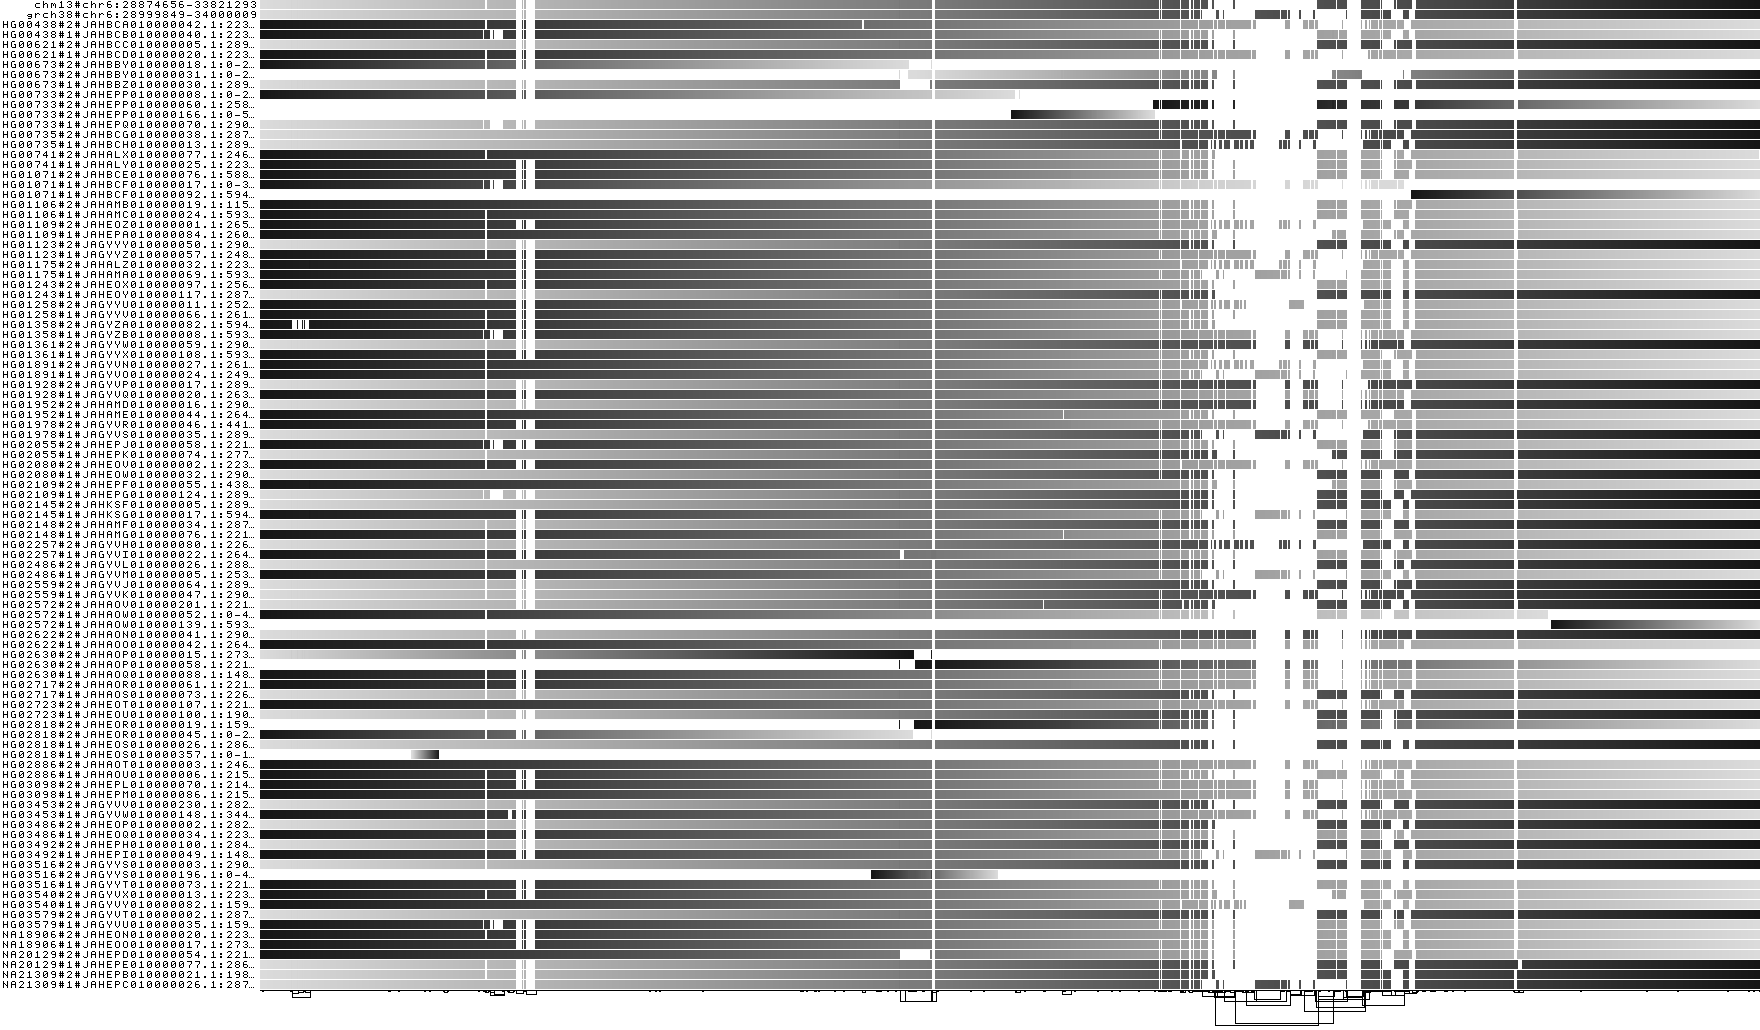
Visualize the MHC by orientation
odgi viz -i${prefix_chr6_smooth}.mhc.og -o ${prefix_chr6_smooth}.mhc.og.z.png -z

Overview of the node orientation of the MHC graph. How would the graph would like if we want to ensure that path HG00733#2#JAHEPP010000166.1:0-551833
is in forward orientation?
Groom the MHC by haplotype HG00733#2
# collect our desired path in a file
odgi paths -i ${prefix_chr6_smooth}.mhc.og -L | head -n 12 | tail -n 1 > HG00733_1
# apply reference-guided grooming
odgi groom -i ${prefix_chr6_smooth}.mhc.og -R HG00733_1 -o ${prefix_chr6_smooth}.mhc.og.groom.og
# take another look at the orientation of path ``HG00733#2#JAHEPP010000166.1:0-551833``
odgi viz -i${prefix_chr6_smooth}.mhc.og.groom.og -o ${prefix_chr6_smooth}.mhc.og.groom.z.png -z
The selected graph is now forward oriented. But what if we want to ensure that all nodes touching our precious references are in forward orientation?
Groom the MHC by haplotypes CHM13 and GRCh38
# collect our desired path in a file
odgi paths -i ${prefix_chr6_smooth}.mhc.og -L | head -n 2 > CHM13_GRCh38
# apply reference-guided grooming
odgi groom -i ${prefix_chr6_smooth}.mhc.og -R CHM13_GRCh38 -o ${prefix_chr6_smooth}.mhc.og.groom_chm13_grch38.og
# take another look at the orientation of the reference paths
odgi viz -i ${prefix_chr6_smooth}.mhc.og.groom_chm13_grch38.og -o ${prefix_chr6_smooth}.mhc.og.groom_chm13_grch38.og.z.png -z
Now the two reference paths are in forward orientation again, as before :)
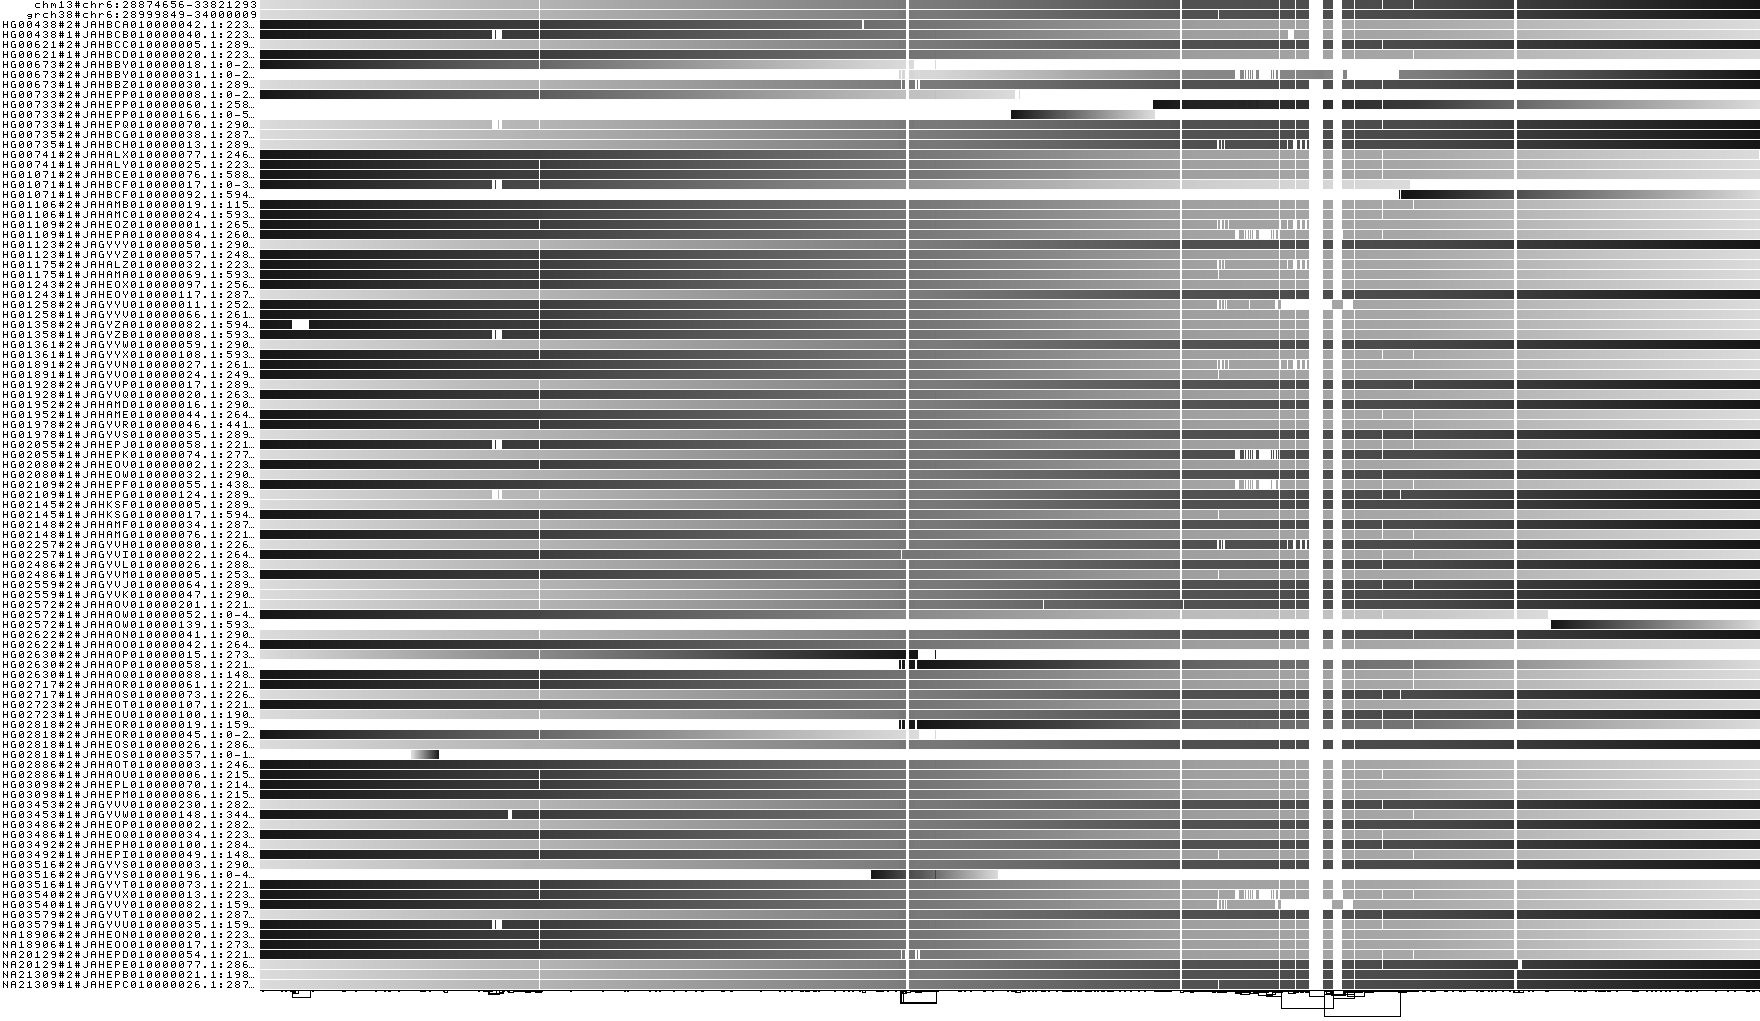
Visualize the MHC by path position
odgi viz -i${prefix_chr6_smooth}.mhc.og -o ${prefix_chr6_smooth}.mhc.og.du.png -du
Assuming we now want to force the 1D layout to respect the path positions of the references better, how to do that?
Sort the MHC by paths CHM13 and GRCh38
# apply reference-path-guided stochastic gradient descent - rPG-SGD
odgi sort -i ${prefix_chr6_smooth}.mhc.og -H CHM13_GRCh38 -o ${prefix_chr6_smooth}.mhc.og.Y_chm13_grch38.og -t 16 -P -Y
# take another look at the orientation of the reference paths
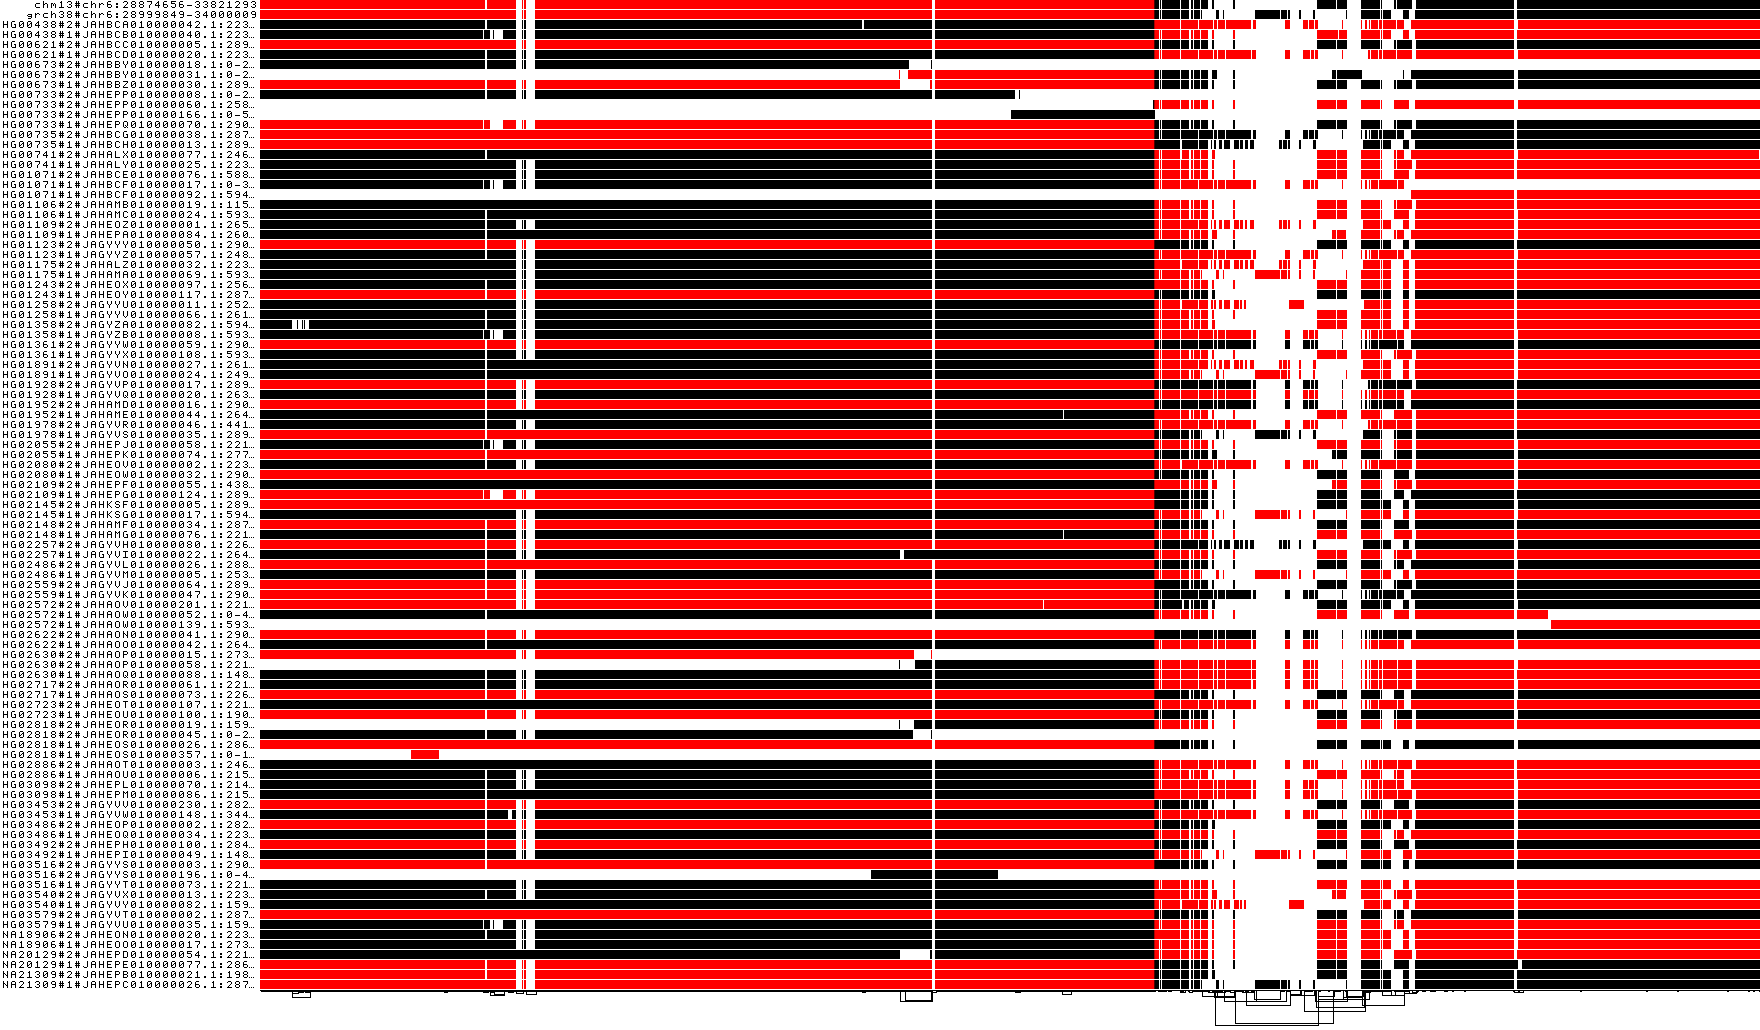
odgi viz -i ${prefix_chr6_smooth}.mhc.og.Y_chm13_grch38.og -o ${prefix_chr6_smooth}.mhc.og.Y_chm13_grch38.og.du.png -du
We can clearly observe, that the path positions of the two reference now define the graph. Both reference show greater continuity compared to before.
2D layout
The 2D PG-SGD layout algorithm is described in https://www.biorxiv.org/content/10.1101/2023.09.22.558964v2.
2D layout of the unsorted DRB1-3123 graph
We want to have a 2D layout of our DRB1-3123 graph:
odgi layout -i DRB1-3123_unsorted.og -o DRB1-3123_unsorted.og.lay -P --threads 2
Note
The 2D PG-SGD implementation comes with a huge amount of tunable parameters. Based on our experience applying it to hundreds of graphs, the current defaults usually work well for most graphs. However, if you feel the resulting 2D layout is not of a good enough quality, there are 2 key parameters one can tune:
-G, --path-sgd-min-term-updates-paths=N: Minimum number of terms N to be updated before a new path-guided 2D SGD iteration with adjusted learning rate eta starts, expressed as a multiple of total path length (default: 10).-x, --path-sgd-iter-max=N: The maximum number of iterations N for the path-guided 2D SGD model (default: 30).
Increasing both can lead to a better graph layout. For example, one can start optimizing with setting -x, --path-sgd-iter-max=100. For more parameter details please take a look at odgi layout.
Drawing the 2D layout of the DRB1-3123 graph
Calculate the 2D layout:
odgi draw -i DRB1-3123_unsorted.og -c DRB1-3123_unsorted.og.lay -p DRB1-3123_unsorted.og.lay.png -C -w 50
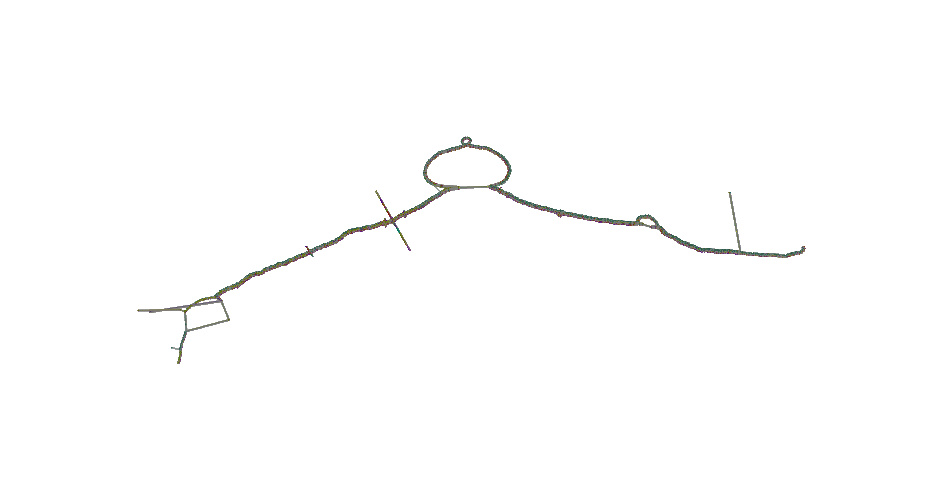
Bonus: the following animation represents what happens during the layout generation.
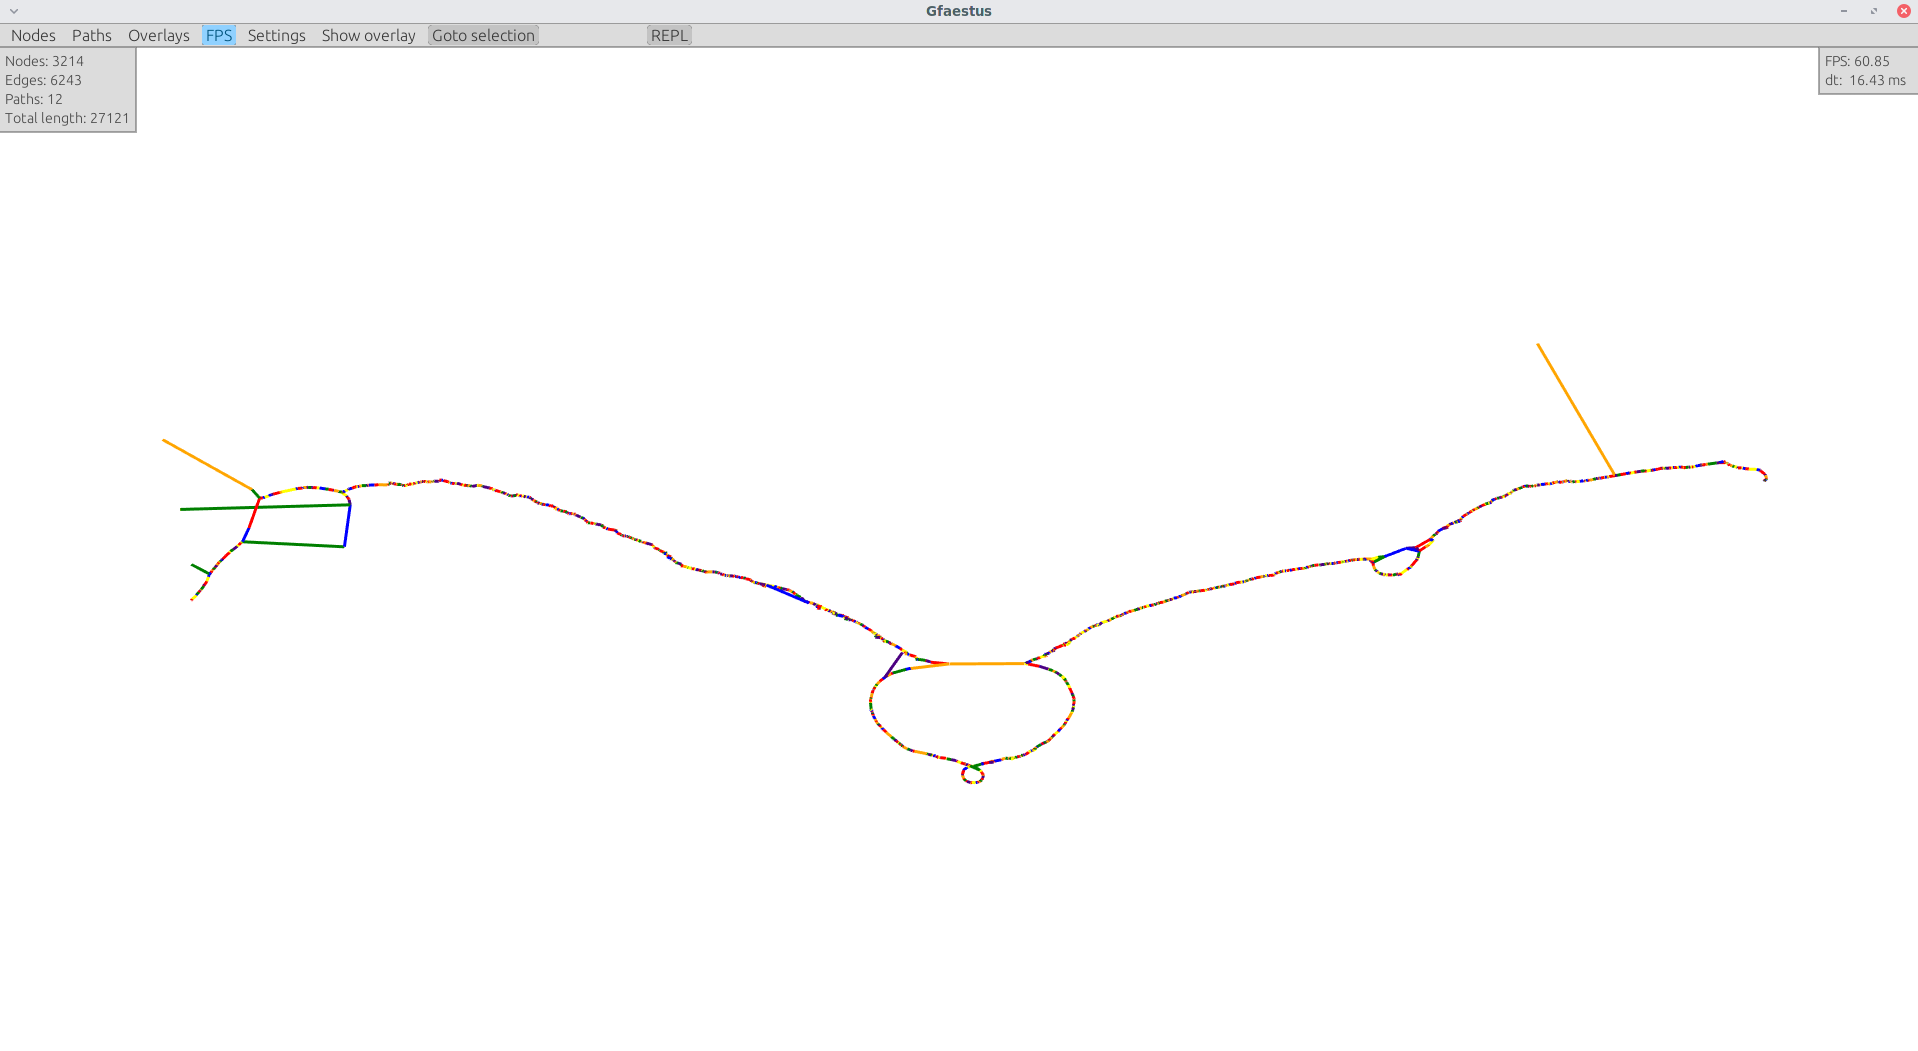
Interactive 2D visualization with gfaestus
gfaestus is a Vulkan-accelerated 2D GFAv1 interactive visualization tool. It currently requires a GFA and an accompanied layout file in TSV format from odgi layout.
We can create the TSV with another run of odgi draw:
odgi draw -i DRB1-3123_unsorted.og -c DRB1-3123_unsorted.og.lay -p DRB1-3123_unsorted.og.lay.png -H 500 -C -w 10 -T DRB1-3123_unsorted.og.lay.tsv
Or, if the layout was not created, yet, we can run odgi layout:
odgi layout -i DRB1-3123_unsorted.og -o DRB1-3123_unsorted.og.lay -P --threads 2 -T DRB1-3123_unsorted.og.tsv
Now download the source code of gfaestus and compile the Rust code:
git clone --recursive https://github.com/chfi/gfaestus.git
cargo build --release
Assuming you made the resulting binary in target/release/gfaestus globally available, you can run:
gfaestus test/DRB1-3123_unsorted.gfa DRB1-3123_unsorted.og.tsv
Then gfaestus will show up: